

How much of a sale did your email program earn? Not the last click before the order, and not an equal fifth of it either, but the real number, the one that accounts for the two Facebook clicks that came before it and the brand search that came after.
That question is the reason attribution modeling exists, and for most of the last fifteen years the industry answered it with rules. You picked one, it applied itself identically to every conversion path in your account, and everyone understood what they were looking at even when it was wrong. Google has now retired nearly all of those rules. Two models are left standing in Google Ads and GA4: last click, and data-driven attribution, with data-driven as the default.
This is the first of three articles on what that means. This one covers where the rules came from, what each one assumed, and the single idea that replaced them. Part 2 opens the machine and walks a real path through it. Part 3 maps its boundaries: what it can see, how far back it looks, and why your numbers keep moving after you’ve reported them.
Attribution by Rule: The Era That Just Ended
Every one of the standard models worked the same way underneath. Each picked an opinion about which touchpoint deserved the money, wrote that opinion down as arithmetic, and applied it to every path in the account without ever checking whether it fit:
- First touch gave everything to discovery, on the theory that none of the rest could have happened without it.
- Last touch gave everything to the final interaction, on the theory that it closed the deal.
- Linear split the credit evenly, on the theory that everybody helped.
- Time decay paid more to whatever happened closest to the sale, along a curve that never changed.
- Position based paid the first and last touch 40% each and let everything in between share the remaining 20%.
- Weighted let you set the percentages yourself, which at least had the virtue of admitting it was a guess.
All six shared one real strength, which is that you could audit them. Anybody could recompute the numbers by hand and see precisely where the credit went and why. And all six shared one fatal weakness, which is that the rule never learned anything. If last touch was wrong about your business in January, it was wrong in exactly the same way in December, and it was wrong identically for the customer who bought in four minutes and the one who took four months.
We wrote all of these up in detail back in 2017, along with several conceptual models we thought the standard set was missing. If you want the rules laid out one at a time, that piece is the history this series builds on.
The Retirement, Briefly
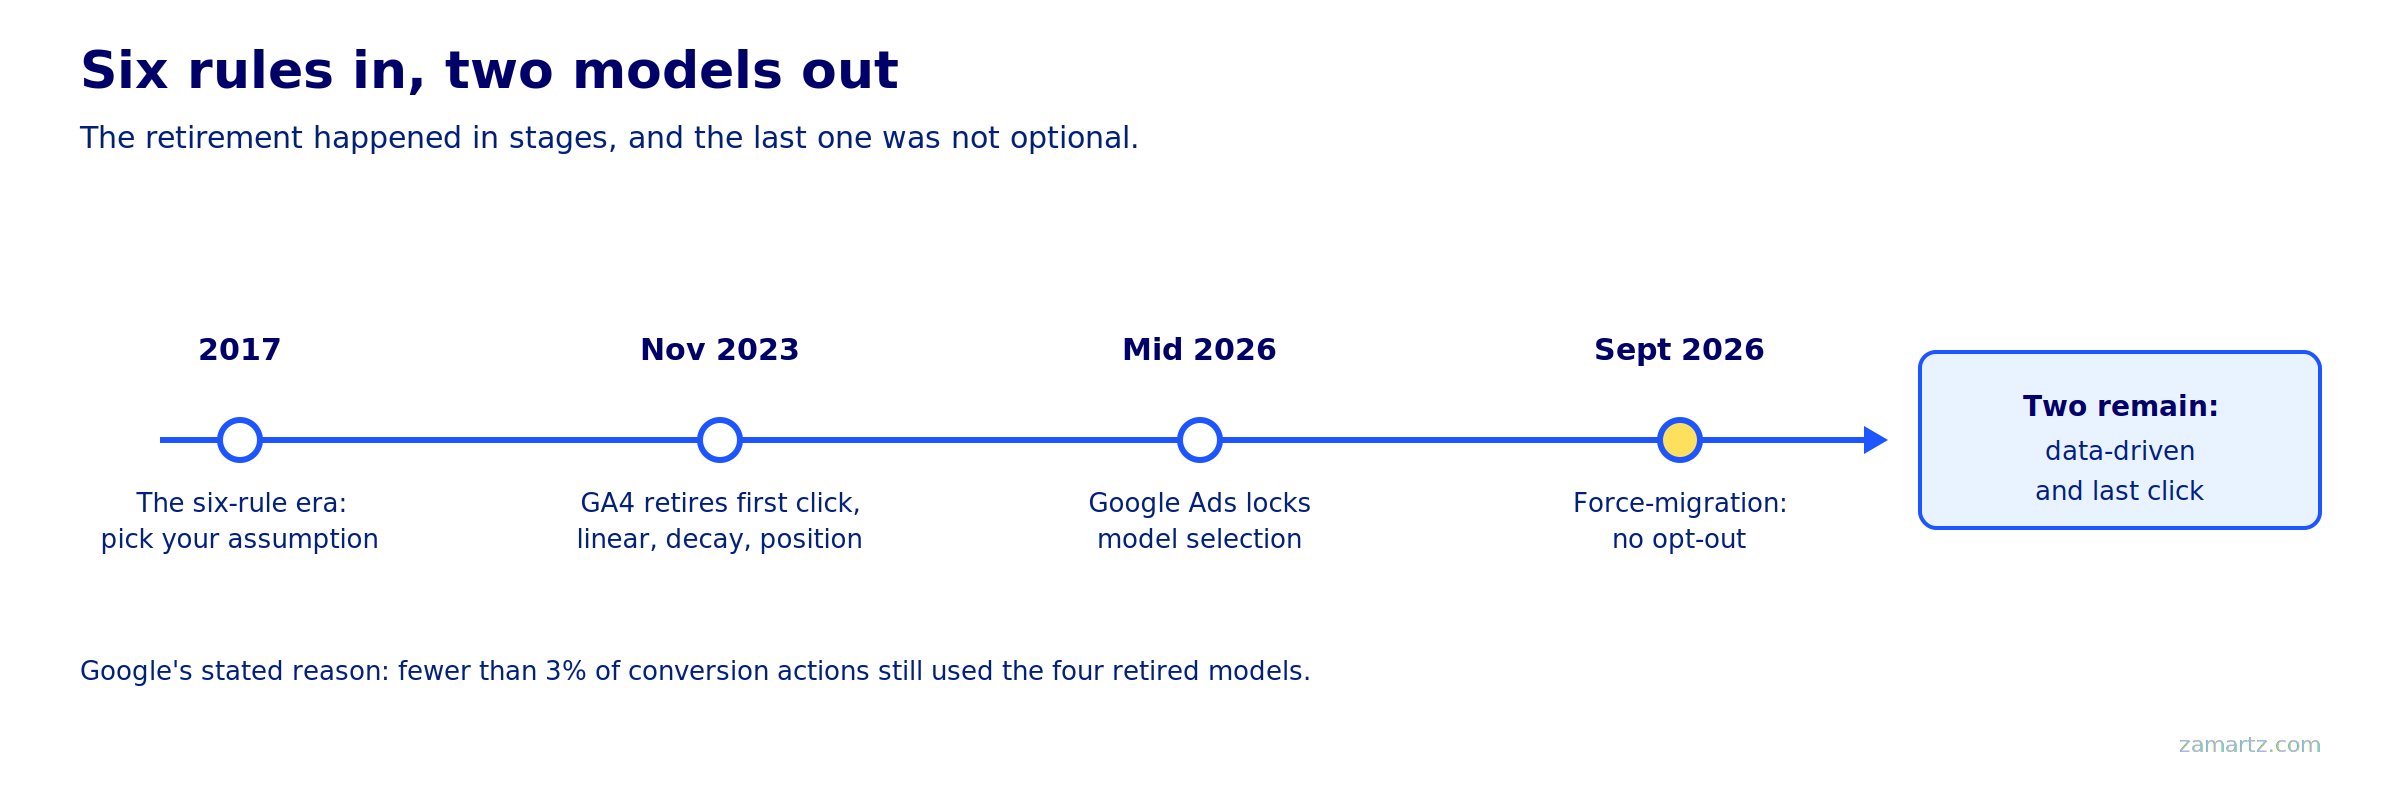
GA4 removed first click, linear, time decay and position-based in November 2023. Google Ads followed through 2026, ending with a forced migration of any conversion action still using one of the four onto data-driven attribution. Google’s stated reasoning was adoption: fewer than 3% of conversion actions were still using them. That part of the case is fair. What got lost is inspectability, and practitioners said so at the time. A rule you disagree with is still a rule you can audit. That is the trade that was made, and the rest of this series is about understanding what you got in exchange.
The One Question That Replaced the Six Rules
Data-driven attribution throws out the question of where a touchpoint sat in the path and replaces it with a harder one: if this touchpoint had not happened, how much less likely was the sale? Google’s GA4 documentation calls this a counterfactual approach, one that “contrasts what happened with what could have occurred.” The methodology document Google publishes for advertisers goes a step further and names the technique family, describing it as an adaptation of “survival analysis,” borrowed from clinical trials and built to model the probability and timing of an event rather than just whether it happened.
Put plainly, the old models asked where a touchpoint was in line. This one asks what the path was worth with the touchpoint in it, and what the same path was worth without it. The difference between those two numbers is the touchpoint’s contribution.
Why the Paths That Failed Matter More Than the Ones That Worked
This is the part almost every explainer skips, and it is the actual engine. A rule-based model only ever looks at paths that converted, because those are the only paths with credit to hand out. Data-driven attribution trains on both, comparing people who saw a given touchpoint against similar people who did not.
Here is why that changes the answer. Say a display placement shows up on nearly every one of your winning paths. A rule-based model reads that as strong performance and pays it accordingly, because presence is the only thing a rule can measure. But if that same placement also shows up on nearly every one of your losing paths, then it is not moving anybody. It is just everywhere. Learning from the failures is what lets a model tell the difference between a touchpoint that was present and a touchpoint that mattered, and it is the single biggest reason data-driven numbers can disagree so sharply with the reports your team has been reading for years.
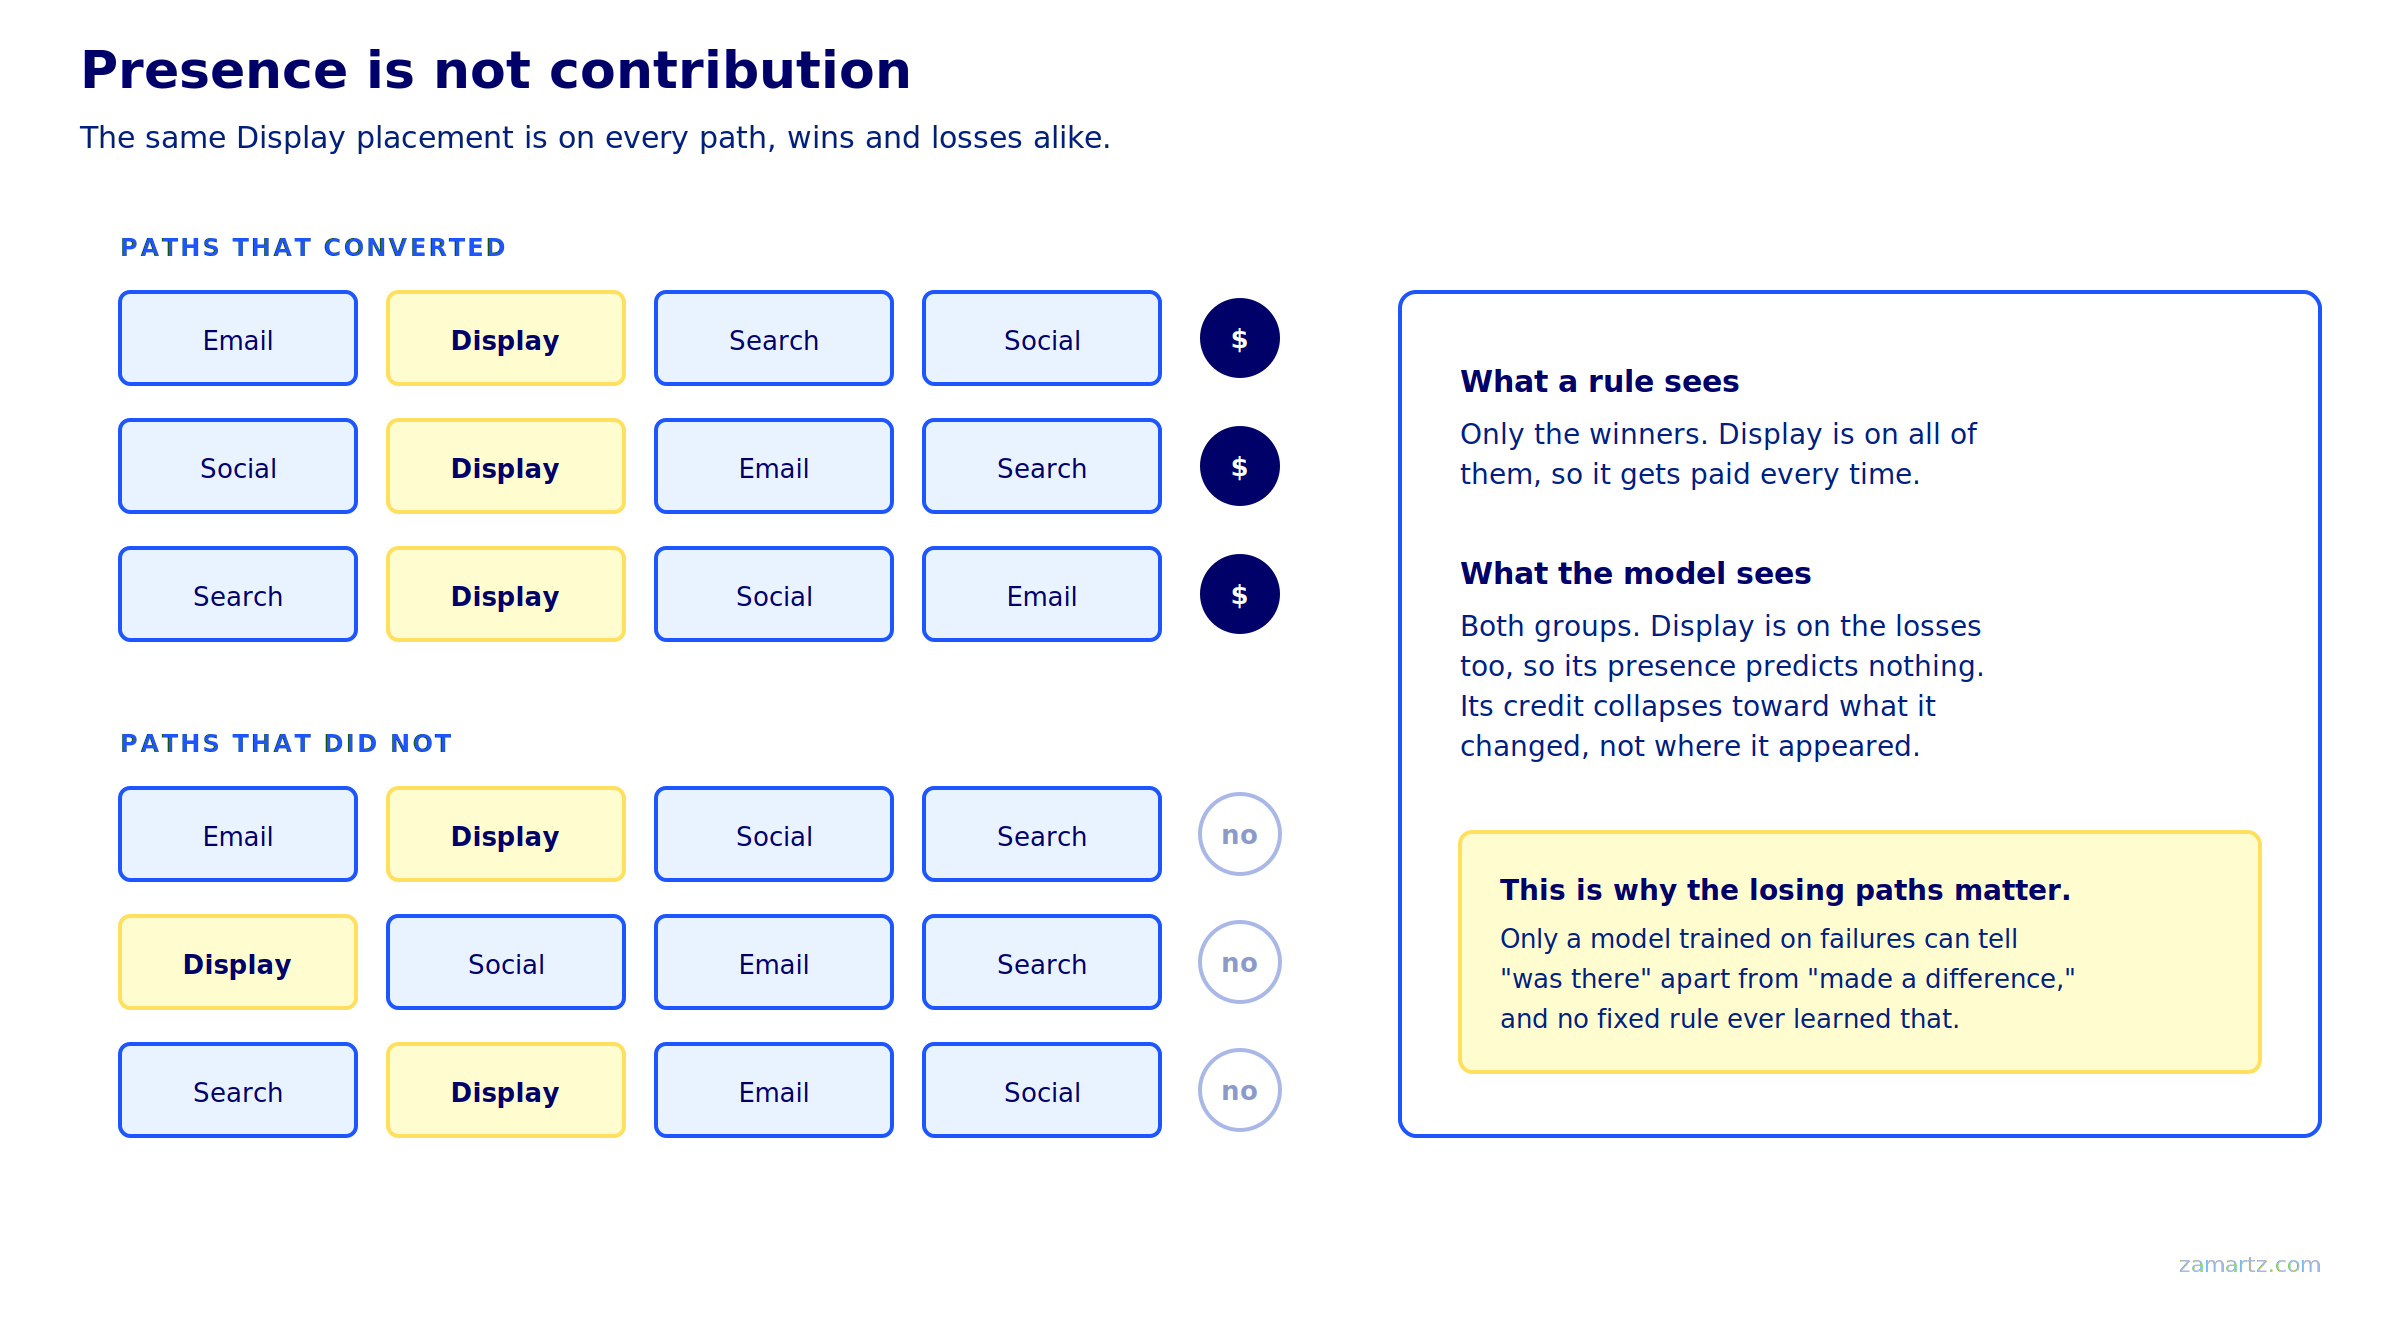
Presence is not contribution. The old rules could not tell those apart. Learning from the paths that failed is what makes the distinction possible.
Your Six Old Models Became Features
If your team learned attribution through the standard framework, none of that knowledge is wasted. The rules were not thrown away so much as demoted from being the answer to being inputs.
| Old model | What it assumed | Where it lives now |
|---|---|---|
| First touch | Discovery deserves the credit | Gone as an option. Survives inside the sequence signal. |
| Last touch | The closer deserves everything | Still selectable as last click. The one rule Google kept. |
| Linear | Everyone contributed equally | Rejected outright. Equal splits are the specific thing this model exists to disagree with. |
| Time decay | Closer in time means more credit | A curve fitted to your data instead of imposed on it. |
| Position based | First and last matter most | Learned position weights instead of a fixed 40/20/40. |
| Weighted by channel | We decide what each channel is worth | Now the model’s job rather than yours. This is the change teams find hardest to accept. |
The Assisted Last-Click ratio we described in the 2017 piece has a new home too. The gap between what a channel earns under last click and what it earns under data-driven attribution is reaching for the same insight that ratio was built for, which is whether a channel closes business or creates it. You can now read that straight off GA4’s Model Comparison report instead of building the metric by hand.
Conclusion
The rule-based era gave you numbers you could recompute by hand that were wrong in a consistent, knowable direction. The data-driven era gives you numbers that are usually closer to the truth and that you cannot check. For most advertisers that is the right trade, because a better estimate you have to trust beats a worse one you can verify. But it changes your job. You are no longer picking the rule. You are auditing the output.
Auditing the output means understanding what the machine is doing, which is where this series goes next. Part 2 builds the model on a whiteboard, walks one buyer’s fourteen-day path through it, and shows why two Facebook clicks forty minutes apart are worth almost nothing while the same two clicks three weeks apart would mean a great deal.
FAQs
A: Two, in both Google Ads and GA4: data-driven attribution and last click. GA4 splits last click into “paid and organic last click” and “Google paid channels last click.” First click, linear, time decay and position-based are gone.
A: Sometimes. For short, high-intent paths where a single closing click really does dominate, or where finance needs one fully auditable number, last click is defensible. It just needs to be a deliberate choice rather than a default you never questioned.
A: Those models applied a fixed curve or fixed weights to every path. Data-driven attribution learns the weights from your account’s own converting and non-converting paths, so the curve fits your buyers instead of an assumption about them.
Sources and Further Reading
- Get started with attribution (Google Analytics Help)
- About attribution models (Google Ads Help)
- Google confirms sunset details for 4 attribution models (Search Engine Land)
- Digital Marketing Channel Interaction Attribution Models (zamartz)