

Part 1 covered how six rules became one model, and Part 2 opened the machine. This last piece is the one to bookmark, because it answers the questions that decide whether the model’s output deserves your budget: what can it see, how far back will it look, and why does a number you reported two weeks ago no longer match the same query today. We verified everything here against Google’s current documentation, and where Google doesn’t document something, we say so instead of guessing.
Two Models Share the Name, and They See Different Worlds
The single most common confusion in this whole subject is that “data-driven attribution” is two different models depending on where you are standing.
- Google Ads DDA scores a competition among Google’s own ad inventory and nothing else. Google’s help documentation names four networks: Search (including Shopping), YouTube, Display, and Demand Gen. Performance Max is not a fifth network, it is a campaign type that spans those same four. The model credits clicks and video engagements only, so a pure impression that was never clicked or engaged gets no DDA credit even inside Google’s walls.
- GA4 DDA scores a competition among every channel you tagged properly. Your Facebook paid clicks, your organic social, your email and your SMS are all in there competing for the same credit, and Google’s own worked example includes Social and Affiliate touchpoints by name.
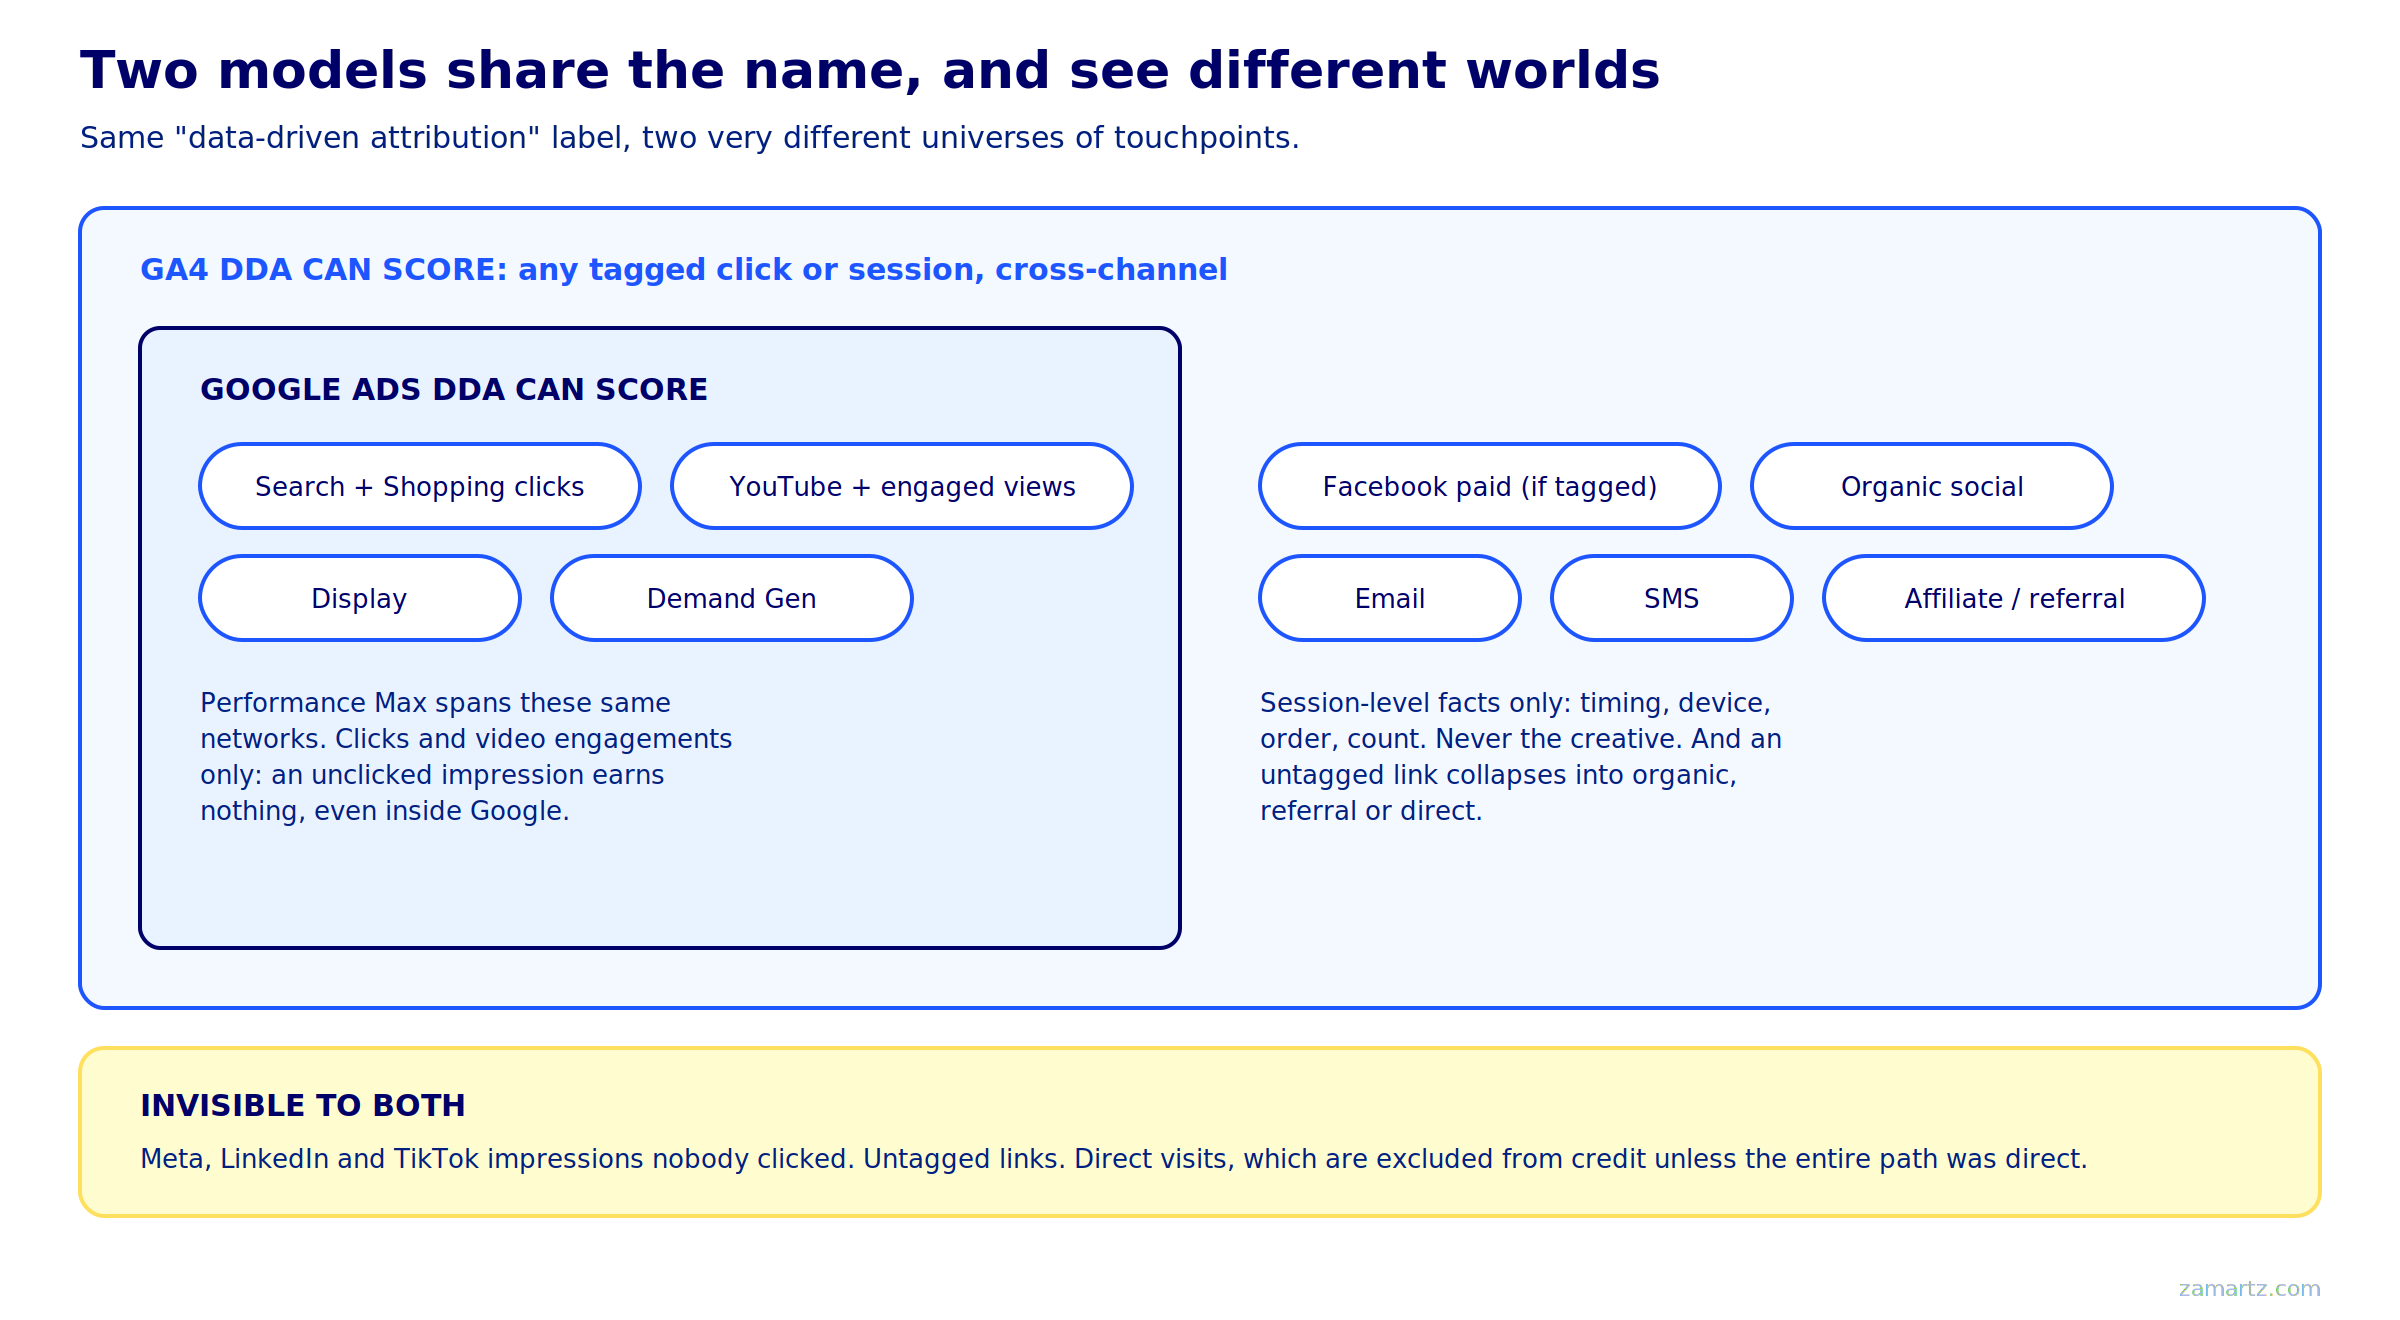
One asterisk on the Ads side that we want on the record. If you import GA4 key events into Google Ads with GA4’s channel-credit setting on “paid and organic channels,” the conversion number Ads displays has already had credit shaved off by GA4’s cross-channel model. You still won’t see a Facebook row inside Google Ads, but the Google Ads figure is smaller because GA4 handed some of the credit to channels Ads can’t display. If your imported conversion counts look low, that is often why.
What Counts as a Touchpoint, Channel by Channel
| Touchpoint | In Google Ads DDA | In GA4 DDA | What the model knows about it |
|---|---|---|---|
| Google Search or Shopping click | Yes | Yes | Everything: creative, format, device, timing, sequence |
| YouTube engaged view | Yes | Yes, even without a site session | Everything, including how the view was earned |
| Display or Demand Gen interaction | Yes | Yes | Everything, including format type |
| Facebook or LinkedIn paid click | No | Yes, if UTM tagged | Arrival time, device, sequence position, count. Not the creative. |
| Organic social, email, SMS, affiliate | No | Yes, if tagged | The same session-level facts |
| A Meta, LinkedIn or TikTok impression nobody clicked | No | No | Nothing. It never happened as far as the model knows. |
| Direct | No | Excluded | Never earns credit unless the entire path was direct |
Three of those rows deserve a sentence each. The YouTube engaged-view row is the lone exception to “GA4 only credits sessions”: Google injects its own engaged views into GA4 as creditable touchpoints even when no visit happened, a privilege reserved for Google inventory. Worth knowing: Ads and GA4 define an engaged view differently (roughly 10 seconds versus 30 seconds of watch time), so don’t conflate the two when someone quotes a threshold. The untagged-social row is the self-inflicted wound: a Facebook ad link with no UTMs lands in organic social or referral, or collapses into direct if the referrer gets stripped, and direct is structurally barred from credit. And the impression row is the strategic one, because your paid social reach is not being undervalued by GA4 so much as it is not being counted at all.
If you make budget decisions from Google Ads DDA alone, you will systematically starve the channels it was never able to score. It is not being unfair to your email program. It cannot see it.
How Far Back the Model Looks
“How far back does Google look?” is really three different questions wearing one coat, and mixing them up is where most bad answers come from. There is the lookback window (how old a touchpoint can be and still earn credit), data retention (how long the granular data exists to be queried), and the conversion window in Google Ads (how long after a click a conversion can still be counted).
GA4 Lookback Windows
| Key event type | Options | Default |
|---|---|---|
| Acquisition (first_open, first_visit) | 7 or 30 days | 30 days |
| All other key events | 30, 60 or 90 days | 90 days |
| YouTube engaged-view | Fixed, not configurable | 3 days |
And the answer to the question every enterprise team asks: GA4 360 does not extend the lookback window. The paid tier’s feature matrix covers retention, BigQuery limits, API quotas and plenty else, and lookback is not on it. Ninety days is the ceiling whether you pay or not.
Retention Is a Different Limit, and 360 Does Change That One
| Setting | Standard GA4 | GA4 360 |
|---|---|---|
| Event-data retention | 2 or 14 months | 2, 14, 26, 38 or 50 months |
| User-data retention | 2 or 14 months | Same as standard |
| Google Signals data | Capped at 26 months | Capped at 26 months |
Retention governs Explorations and the Data API, not the standard aggregated reports, which keep displaying totals long after the granular data behind them has aged out. The practical consequence: even where a lookback window would allow an old touchpoint to earn credit, once the granular events pass the retention horizon you cannot rebuild that path analysis in Explore. If you need history past these limits, the documented path is the BigQuery export plus your own modeling, and note what the export contains: raw event-level data with last-click session attribution. GA4’s data-driven fractional credit is not in the export at all, so you cannot reconstruct DDA numbers from BigQuery, only build your own attribution on the raw events.
Google Ads Conversion Windows
| Window | Range | Default |
|---|---|---|
| Click-through | 1 to 90 days | 30 days |
| Engaged-view | Up to 90 days | 3 days |
| View-through | Up to 90 days | 1 day |
One more thing Google does not publish, so we won’t pretend otherwise: there is no documented training window or refresh cadence for the DDA model itself. Google describes it as dynamic and responsive to changes in the account, and that is as specific as the documentation gets. Anyone quoting a “weekly retrain” is inferring, not citing.
Why the Number You Reported Has Changed Since
This is the section to send to whoever owns your weekly dashboard, because a figure pulled on Monday for last Tuesday is not final, and that is by design rather than by bug. The moving parts, each of them documented:
- Processing lag. GA4 data processing can take 24 to 48 hours, and reports can change during that time.
- Reattribution. Google states that GA4 conversions can be reattributed for up to 7 days after the conversion, as late touchpoints and modeled data arrive and the credit gets recomputed.
- Click-date accounting in Ads. Google Ads books a conversion to the date of the click that earned it, not the date it happened. A click from three weeks ago can gain a conversion today, rewriting that older date’s row, and this continues for the length of the conversion window, up to 90 days. The “Conversions (by conv. time)” column exists precisely because of this.
- Consent-mode modeling. Where users decline tracking, Google models the missing conversions and blends them into the same columns, with no flag on the row. Modeled conversions arrive on a lag and get attributed back to earlier dates, which is a common reason past numbers drift upward.
- Setting changes behave asymmetrically. Changing the reporting attribution model in GA4 applies to historical and future data, so your whole history gets restated under the new model. Changing the lookback window applies going forward only. People routinely get this backwards, and Google documents both behaviors explicitly.
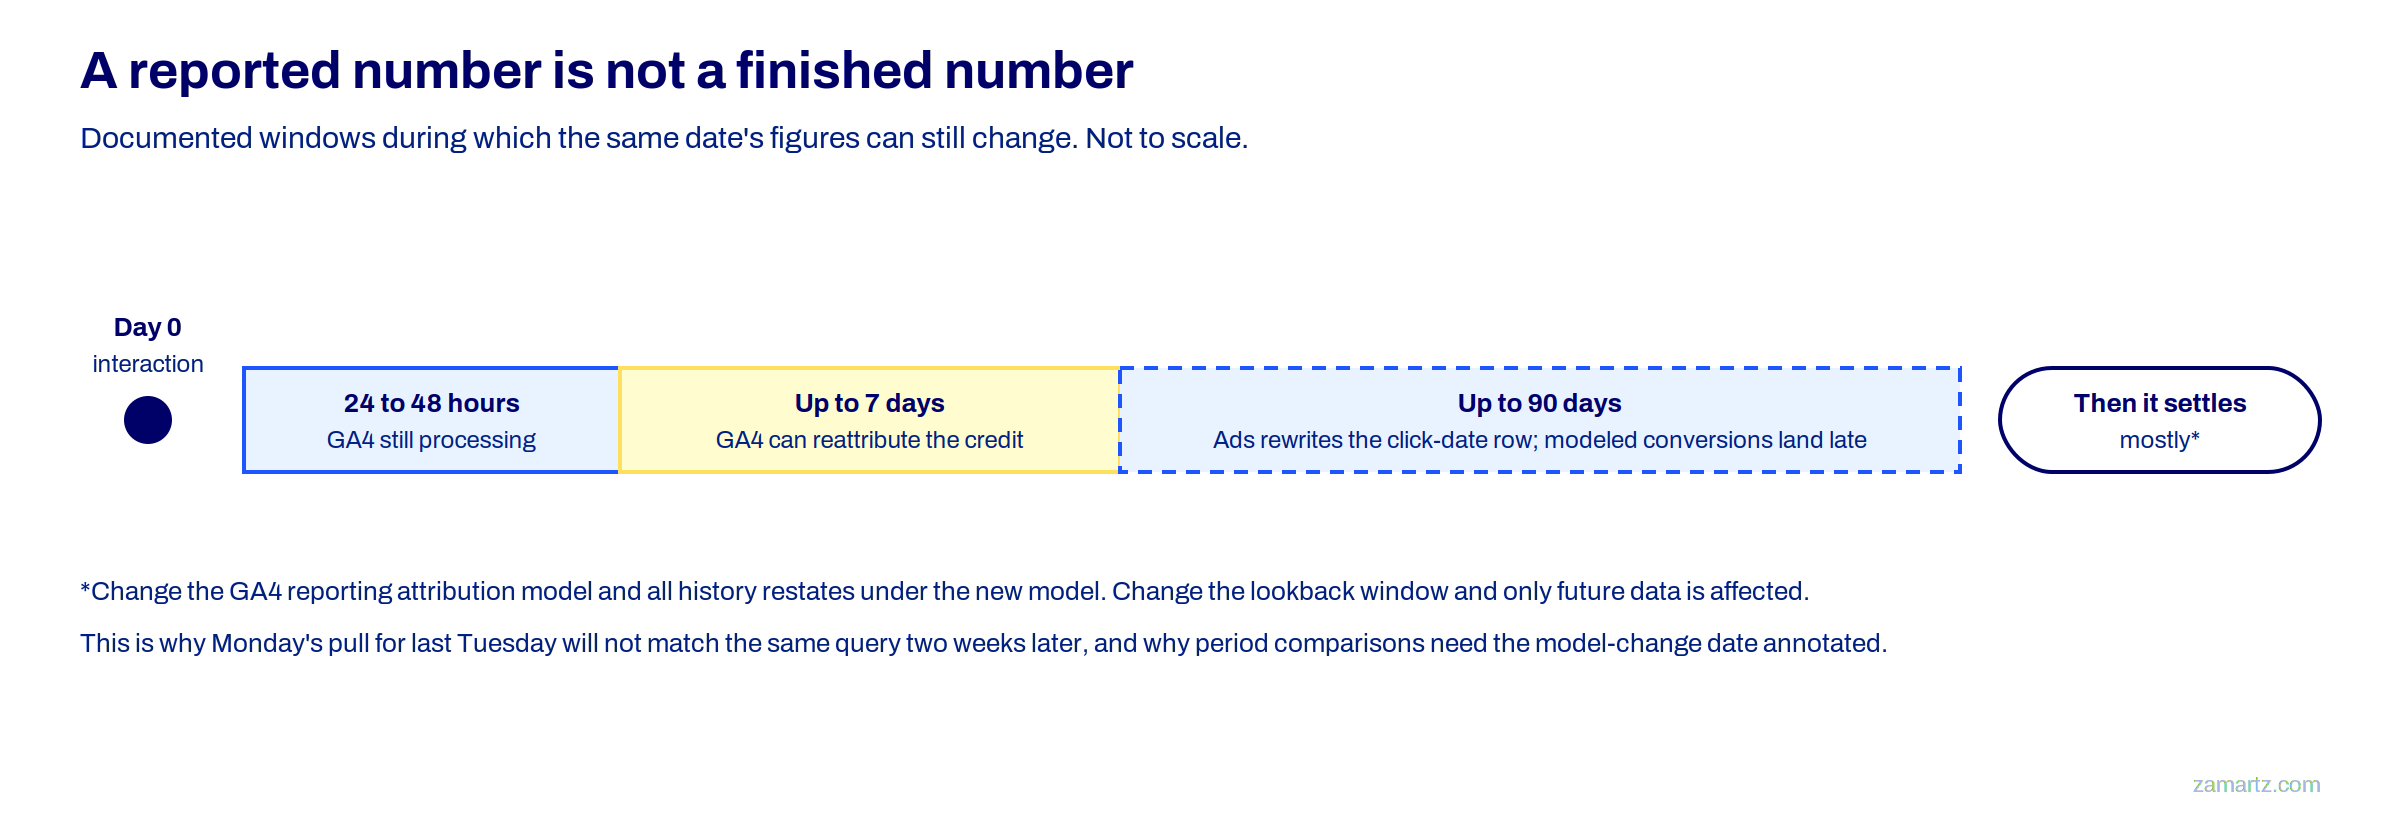
Whether DDA quietly restates fractional credit for periods older than that 7-day window is not documented either way. Practitioners report watching a past week’s percentages drift as the model updates, and we’ve seen it too, but that is observation rather than documentation, and we’d rather label it honestly than dress it up as a fact.
About Those “400 Conversions and 20,000 Events”
You will see this claim just about everywhere: GA4 needs 400 conversions for a key event plus 20,000 events in the lookback window, or it silently falls back to last click. We went looking for the source and could not find it in any current Google GA4 documentation. The 400 traces back to legacy Universal Analytics multi-channel funnels, a different product with different plumbing. The 20,000 does not trace anywhere we could find. And legacy UA told you when it could not build a model, so even the “silently” part is borrowed from something that behaved the opposite way.
What is documented: every Google Ads conversion action is eligible for DDA regardless of volume, with a recommendation of at least 200 conversions and 2,000 ad interactions per 30 days for the model to perform well. GA4 publishes no volume threshold at all. Does volume still matter? Of course, for the comparison-group reason from Part 2: thin data makes the lookalike groups stop resembling each other. If you run forty conversions a month, treat the channel splits as a weak signal. But that is our judgment about confidence, not a documented cutoff, and you deserve to know which one you are being handed.
How to Pressure-Test What the Model Tells You
- Read the model comparison first. In GA4, put last click and data-driven side by side for the same date range. You are not looking for which one is right, you are looking at the size and direction of the gap per channel, because that gap is the assist story.
- Sanity-check the winners against your spend. If a channel you spend $400 a month on suddenly earns 15% of revenue, that is far more likely to be a model artifact than a discovery.
- Watch the Ads-to-GA4 gap as its own metric. The two will not reconcile, by design: different date logic, different counting, different universes. A stable gap is normal. A gap that jumps is a tagging or consent problem worth chasing.
- Suppress a channel on purpose. Turn one off for a defined window, hold everything else steady, and watch total revenue rather than the channel’s own reported revenue. It is the cheapest real evidence available to you.
- Run a geo holdout for anything large. Matched markets, one with the channel and one without, answers a question attribution cannot.
- Bring in media mix modeling if you have offline or retail media. Anything that never touches your site cannot be attributed at all, so it has to be modeled at the portfolio level instead.
Conclusion
Data-driven attribution is a good estimate with sharp edges. It sees Google’s world in high definition, everyone else’s world only where a click left a footprint, and nothing at all where an impression never became a session. It looks back 90 days at most, on any tier, and it reserves the right to revise the recent past. None of that makes it untrustworthy. It makes it an instrument with a range, and instruments with ranges are used well by people who know where the range ends.
So let it run your day-to-day optimization, read the last-click gap as your assist signal, and once a year buy yourself a piece of real evidence with a suppression test or a geo holdout. The model’s story and your revenue will often line up. Lining up is not the same as causing it. And if you are trying to explain any of this series to a leadership team that still thinks in first and last touch, that is a conversation we have most weeks.
FAQs
A: In GA4 yes, for any tagged channel that produced a session, plus YouTube engaged views. In Google Ads no: that model scores Search and Shopping, YouTube, Display and Demand Gen, with Performance Max spanning those same networks.
A: No. 360 extends event-data retention to as much as 50 months, but the attribution lookback options are identical to standard GA4, with 90 days as the ceiling.
A: GA4 documents reattribution for up to 7 days after a conversion, on top of 24 to 48 hours of processing lag. Google Ads rewrites past dates for the length of the conversion window, up to 90 days, because conversions are booked to the click date. Beyond that, no restatement behavior is documented.
A: Yes. Changing the GA4 reporting attribution model applies to historical and future data. Changing the lookback window applies going forward only. Annotate the date either way, because comparisons that straddle the change are comparing two different rulebooks.
A: We could not find that requirement in any current Google GA4 documentation. It appears to come from legacy Universal Analytics. Google Ads publishes a recommendation of 200 conversions and 2,000 ad interactions per 30 days, and calls it a recommendation.
Sources and Further Reading
- Get started with attribution (Google Analytics Help), model scope, direct-visit exclusion, and the 7-day reattribution note
- Select attribution settings (Google Analytics Help), lookback windows and the retroactivity rules
- Data retention (Google Analytics Help)
- GA4 360 feature limits (Google Analytics Help)
- About data-driven attribution (Google Ads Help)
- About conversion windows (Google Ads Help)
- About consent mode modeling (Google Ads Help)
- Digital Marketing Channel Interaction Attribution Models (zamartz)