

In Part 1 of this series we covered how attribution went from six auditable rules to one learned model, and the question that model asks: if this touchpoint had not happened, how much less likely was the sale? This article opens the machine. Google does not publish its production architecture and is not going to, but it publishes enough of the pieces (the input signals, the counterfactual logic, the survival-analysis framing, and the fact that credit across a path always sums to 1.0) that we can sketch something which behaves the same way. This is how we draw it when a team wants to see the shape of the thing rather than take it on faith.
The Signals a Probabilistic Model Has to Weigh
Strip away the Google-specific vocabulary and there are four things any honest probabilistic model has to account for, no matter which channel a touchpoint came from:
- Timing. How long between this touchpoint and the sale, and how long since the one before it. The old time decay model applied one fixed curve to everybody, while a learned model fits the curve to your data. If your buyers take three weeks to decide then an interaction on day 18 can carry real weight, and if they buy within the hour then day 18 is close to noise.
- Frequency. How many times this person came through this same channel. The first Facebook click and the fourth Facebook click are not worth the same thing, and which way that runs depends on your category, your creative and your audience size.
- Sequence. What came before and after, and in what order. Two Facebook touches followed by an email is a different story than a Facebook touch, then an email, then two more Facebook touches, and a model that ignores order cannot tell those apart.
- Device. Phone, tablet, desktop, and the switches between them. A phone touch that precedes a desktop purchase behaves differently than a desktop click that closes on the spot.
Then there is a fifth signal that only works inside Google’s own inventory, which is creative and ad format type. A skipped bumper, a YouTube engaged view and a Shopping click are different events with different predictive power, and Google can tell them apart because Google served them. Your Facebook click doesn’t share the same plumbing: GA4 knows a session arrived from Facebook paid, on a phone, at 9:14pm, third in a sequence of five, and it can time that and count that and place it in order. It has no idea what the creative was. We map the full can-see and can’t-see boundary in Part 3.
Google’s documentation names its version of this list as time from the conversion, device type, number of ad interactions, the order of ad exposure, and the type of creative assets. One caveat we would rather state than paper over: the credit-assignment step also refers to “other query signals” without saying what they are. So when you read elsewhere that the model weighs browser, geography or audience segment, treat that as plausible and undocumented. It may well be in there. Google hasn’t published it, and we are not going to tell you it is confirmed when it isn’t.
The Pipeline, End to End
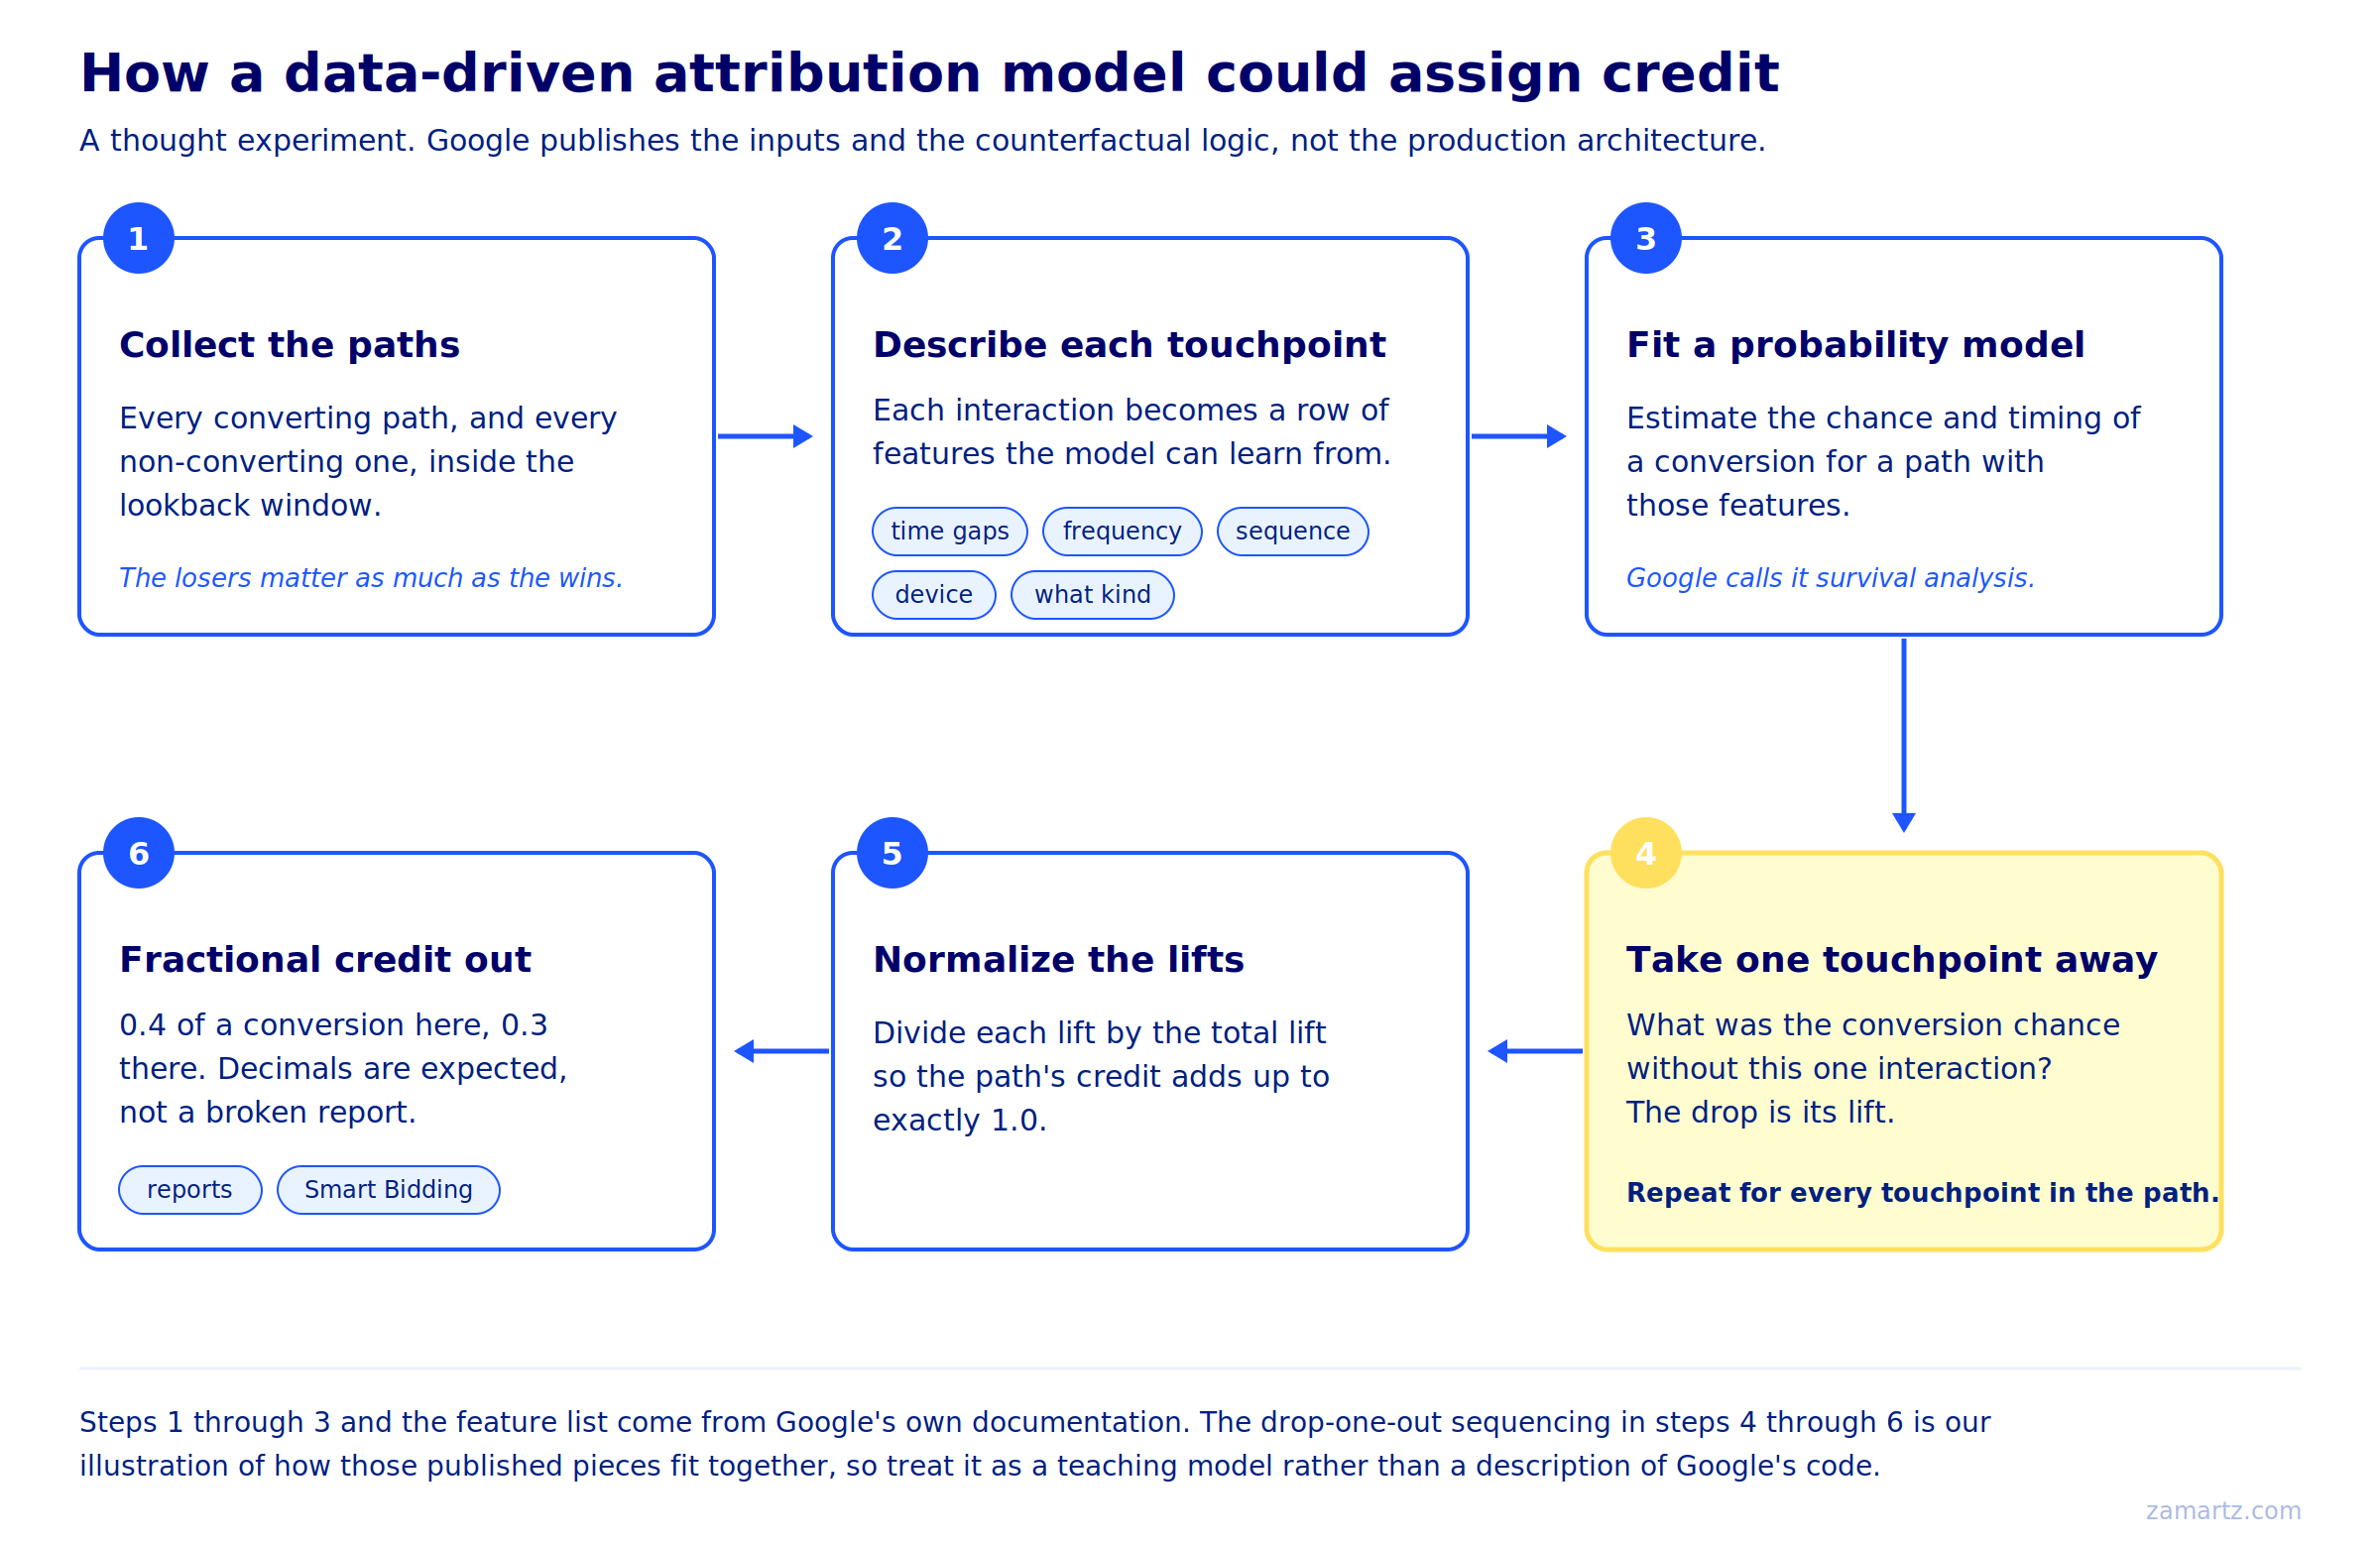
Step One: Describe the Path as Features, Not Positions
Take one real-looking buyer. She clicks a Facebook ad on her phone, clicks another Facebook ad forty minutes later, clicks through an email three days after that, comes back through organic search a week and a bit later, and finally arrives on a brand paid search click two hours before placing a $200 order. Fourteen days, five touchpoints, four channels.
A rule-based model reduces that entire story to a position number. A probabilistic model has to describe it properly first:
| # | Touchpoint | Device | Gap since previous | Time to order | Nth on this channel |
|---|---|---|---|---|---|
| 1 | Facebook paid click | mobile | first touch | 14 days | 1st Facebook |
| 2 | Facebook paid click | mobile | 40 minutes | 14 days | 2nd Facebook |
| 3 | Email click | mobile | 3 days | 11 days | 1st email |
| 4 | Organic search | desktop | 8 days | 3 days | 1st organic |
| 5 | Brand paid search click | desktop | 3 days | 2 hours | 1st brand |
The two Facebook clicks are the reason this level of detail is not optional. Forty minutes apart, on the same phone, that is one person in the middle of deciding, and the second click barely tells you anything the first one didn’t already say. Move those same two clicks three weeks apart and they become two separate decisions to come back, and the second one means a great deal. Linear called them equal to each other and to everything else. Last touch called them both worthless. Neither rule had any way to know which situation it was looking at, because neither rule was looking at the gap.
Step Two: Find Something to Compare It To
A lift number is meaningless on its own, because lifted above what? This is where the non-converting paths from Part 1 earn their keep. Google describes comparing people who were exposed to an ad against similar people in a holdback group who were not, which is the logic of a clinical trial pointed at media. Two things have to be true for that comparison to mean anything:
- The comparison group has to resemble the exposed group in the ways that matter, so roughly the same intent, the same device mix, the same point in the season. Otherwise you are measuring the difference between two kinds of people rather than the effect of an ad.
- There has to be enough of both. This is the honest reason volume matters for these models. It is not that the math breaks below some threshold, it is that with thin data the comparison groups stop resembling each other and the lift estimates start bouncing around.
So the probability model is not really scoring your one buyer. It is scoring the pattern she belongs to, learned from everyone who looked like her and bought and everyone who looked like her and didn’t.
Step Three: Take One Touchpoint Away
Once you can score a path, the credit logic is almost embarrassingly simple. Written as pseudocode:
for each path P in the lookback window:

    base = probability_of_conversion( features(P) )

    for each touchpoint t in P:
        without_t = probability_of_conversion( features(P minus t) )
        lift[t]   = base - without_t          # what fell off when t left

    total_lift = sum(lift)

    for each touchpoint t in P:
        credit[t] = lift[t] / total_lift      # always sums to 1.0
Ten lines, and none of the difficulty lives in them. All of it sits inside that one call to probability_of_conversion(), which is where the timing and the frequency and the sequence and the device get weighed, and which is the part Google keeps. That is worth being clear about, because it tells you exactly where the black box starts. The bookkeeping is simple and knowable. The scoring is neither.
Here is the mechanic drawn out for one touchpoint, the second Facebook click:
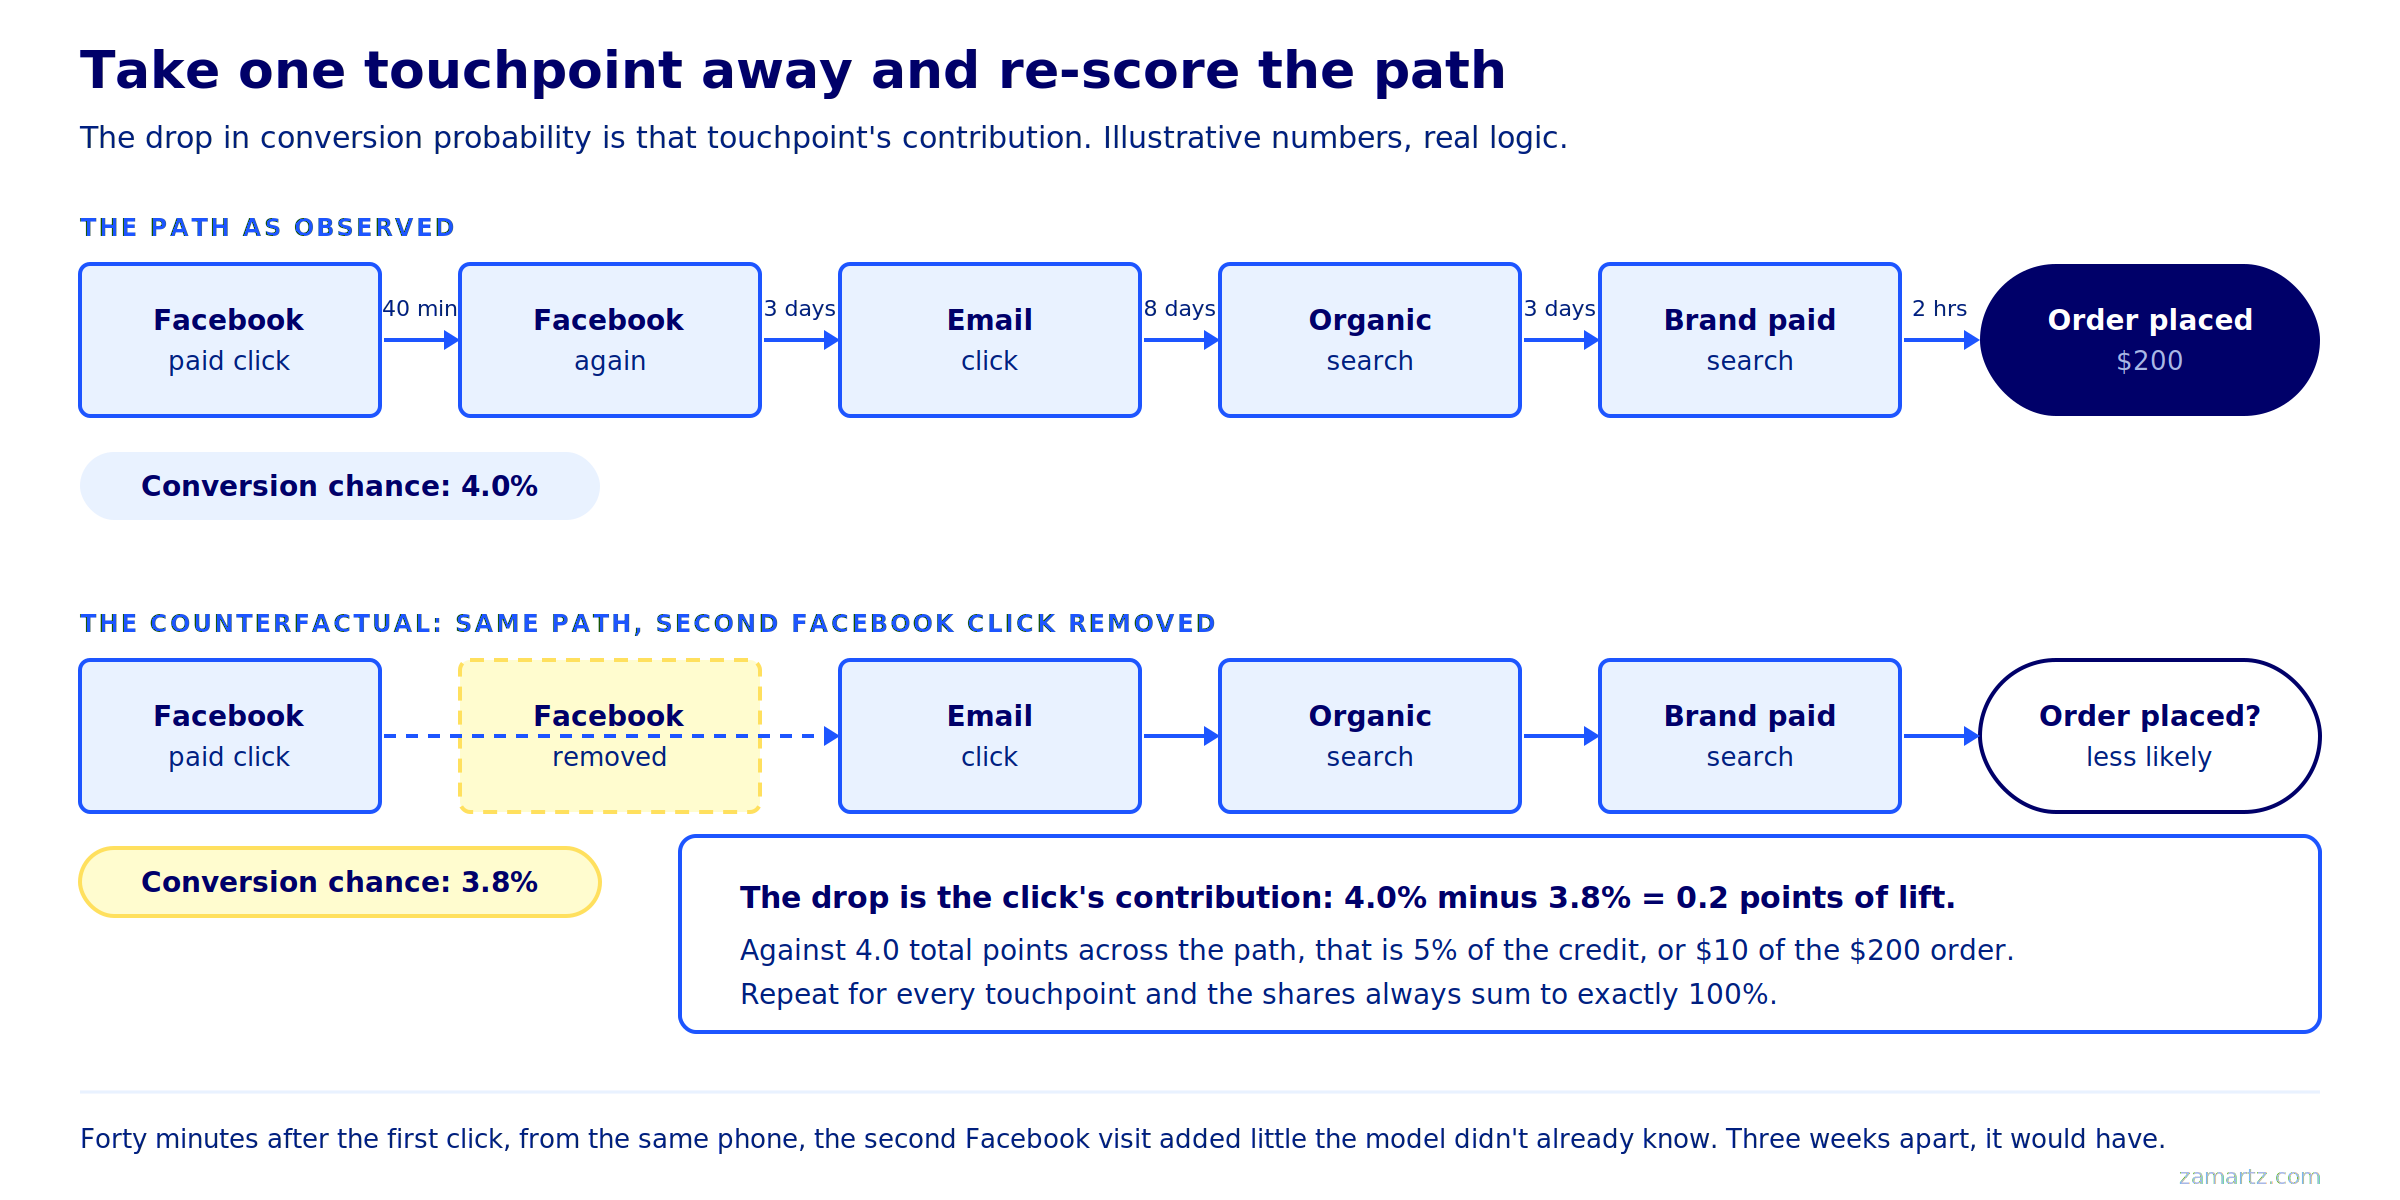
Do that for all five touchpoints and the whole $200 divides itself:
| Touchpoint removed | Path chance without it | Lift it added | DDA credit | Share of $200 |
|---|---|---|---|---|
| Facebook paid click (1st) | 3.6% | 0.4 pts | 10% | $20 |
| Facebook paid click (2nd) | 3.8% | 0.2 pts | 5% | $10 |
| Email click | 3.2% | 0.8 pts | 20% | $40 |
| Organic search | 2.6% | 1.4 pts | 35% | $70 |
| Brand paid search click | 2.8% | 1.2 pts | 30% | $60 |
| Total | baseline 4.0% | 4.0 pts | 100% | $200 |
Look at the second Facebook click, because it is the entire argument for putting up with a black box. It arrived forty minutes after the first one, from the same phone, from somebody already mid-decision, so the model gives it 5%, which is $10 of a $200 order. Linear handed it $40, the same as everything else in the path. First touch and last touch both handed it nothing. Only a model that knows the gap was forty minutes rather than three weeks can arrive at $10, and that specific kind of judgment is what you are trading auditability for.
And here is the same path under the models that used to be on the menu:
| Model | Facebook 1 | Facebook 2 | Organic | Brand paid | |
|---|---|---|---|---|---|
| First touch (retired) | 100% | 0% | 0% | 0% | 0% |
| Last touch (still available) | 0% | 0% | 0% | 0% | 100% |
| Linear (retired) | 20% | 20% | 20% | 20% | 20% |
| Data-driven | 10% | 5% | 20% | 35% | 30% |
The other thing worth noticing is that organic search takes the biggest share at $70, and it is a channel you cannot bid on. Google Ads data-driven attribution will never tell you that, because organic isn’t in its universe at all. GA4 will. That gap between the two reports is not a discrepancy to reconcile, it is two different questions being answered, and it is exactly where Part 3 picks up.
The bookkeeping is ten lines of pseudocode anyone can follow. The scoring function inside it is the part Google keeps, and knowing where that line sits is most of what “black box” should mean to you.
Conclusion
So the machine learning is not mystical. It describes each touchpoint by its timing, its repeats, its order and its device, scores the path’s conversion probability against lookalikes who didn’t buy, and pays each touchpoint by what falls off when you remove it. The judgment it makes about those two Facebook clicks is the whole value proposition, and the opacity of the scoring function is the whole cost.
What it cannot do is score what it cannot see, and the two models wearing the “data-driven” name see very different worlds. Part 3 maps those boundaries: the Google Ads universe versus the GA4 universe, how far back each will look, what the 360 tier does and does not buy you, and why a number you reported two weeks ago has quietly changed since.
FAQs
A: Timing, frequency, sequence and device carry across every channel. Creative and ad format type apply only inside Google’s own inventory. Google’s published list names time from the conversion, device type, number of ad interactions, the order of ad exposure, and the type of creative assets, plus unspecified “other query signals.”
A: It is a teaching model built from what Google publishes: the counterfactual comparison, the survival-analysis framing, the holdback groups, and credit that sums to 1.0. The production architecture is not public, so treat the sequencing as ours and the ingredients as Google’s.
A: Because credit for one sale gets split across several touchpoints and the pieces have to add up to exactly one. Decimals are the model working correctly rather than a broken tag.
A: Because last click was flattering it. Brand search tends to be the last thing someone touches before buying, which earned it 100% under the old rule. A model that asks what would have happened without it usually concludes the buyer would have found their way back regardless, so the credit moves earlier in the path.
Sources and Further Reading
- Get started with attribution (Google Analytics Help), the primary source for the published signals and the counterfactual framing
- About data-driven attribution (Google Ads Help), including the downloadable methodology document
- Shao and Li, “Data-driven multi-touch attribution models,” KDD 2011, the academic starting point for this family of models
- Digital Marketing Channel Interaction Attribution Models (zamartz)